InfluxDB to VictoriaMetrics
Idea
A colleague introduced me to a tool called VictoriaMetrics.
The tool is primarily intended as long-term storage for Prometheus (exactly my use case  ), but can also be used
as a listener for InfluxDB or Graphite, for example, by means of suitable switches.
), but can also be used
as a listener for InfluxDB or Graphite, for example, by means of suitable switches.
The queries for the DB are PromQL compatible, but they can also be used with an
extended syntax (MetricQL).
Since InfluxDB 1.8 is more or less EOL and I'm not really warming up to 2.0, I decided to take a look at the tool.
For currently captured data, I simply added it to Prometheus with another remote_write.
remote_write:
  - url: "https://influxdb.underverse.net/api/v1/prom/write?db=prometheus"
  - url: "https://victoriametrics.underverse.net/api/v1/write"
Another important aspect was the further use of historical data (retention of Prometheus was only 3 days), which was also uncomplicated.
Migration
The data migration was done using the vmctl tool, which copies from influxdb to victoriametrics:
./vmctl-linux-amd64 influx --influx-addr https://influxdb.underverse.net --influx-database prometheus --vm-addr https://victoriametrics.underverse.net

InfluxDB import mode
2020/12/28 13:34:09 Exploring scheme for database "prometheus"
2020/12/28 13:34:09 fetching fields: command: "show field keys"; database: "prometheus"; retention: "autogen"
2020/12/28 13:34:09 found 1871 fields
2020/12/28 13:34:09 fetching series: command: "show series"; database: "prometheus"; retention: "autogen"
2020/12/28 13:34:10 found 33882 series
Found 33882 timeseries to import. Continue? [Y/n]
33882 / 33882 [---------------------------------------------------------------------------------------------------------------------------------------------------------------------------------------------------------------] 100.00% 2 p/s
2020/12/28 17:43:29 Import finished!
2020/12/28 17:43:29 VictoriaMetrics importer stats:
  idle duration: 6h53m48.731032321s;
  time spent while importing: 4h9m17.833915436s;
  total samples: 2458577090;
  samples/s: 164367.19;
  total bytes: 48.8 GB;
  bytes/s: 3.3 MB;
  import requests: 12135;
  import requests retries: 0;
2020/12/28 17:43:29 Total time: 4h9m20.409837504s
Here, one year's data from InfluxDB was ingested into the VictoriaMetrics DB. According to the metrics, the utilization here was higher on the InfluxDB side:
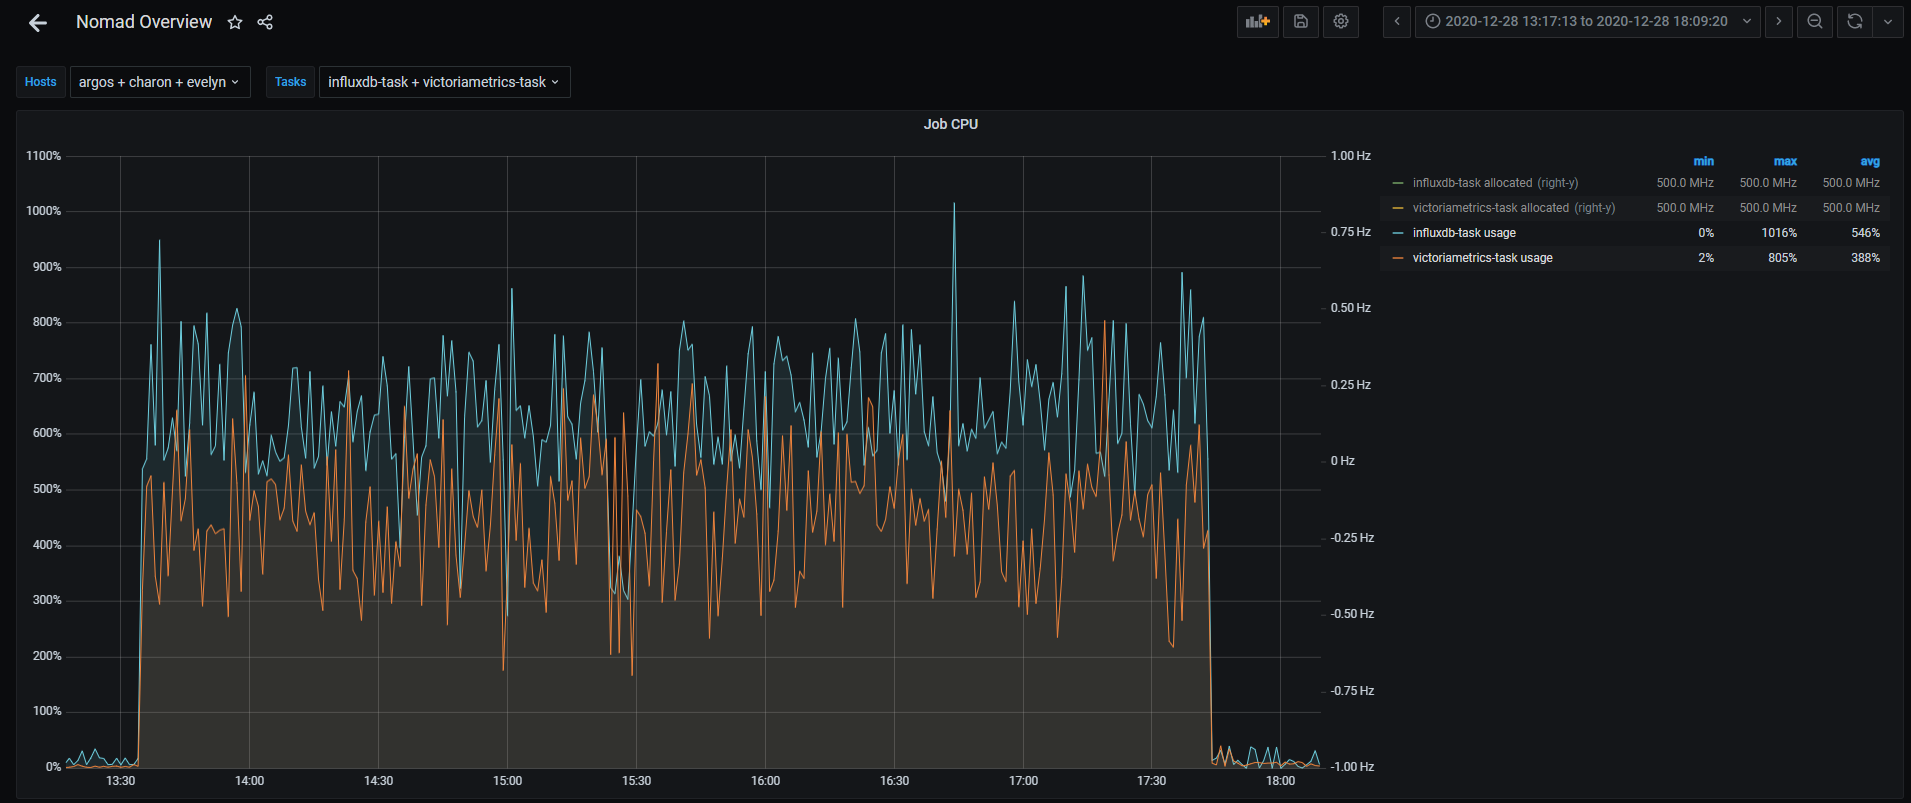
The comparison is probably a little off, as the vmctl also eats up CPU (around 60% in spot observations).
However, the result is quite respectable:
du -sh /var/lib/docker/volumes/influxdb/ /var/lib/docker/volumes/victoriametrics/
7,5G    /var/lib/docker/volumes/influxdb/
1,2G    /var/lib/docker/volumes/victoriametrics/
This results in a ratio of 1:6.25 for the above-mentioned number of series and samples.
I would assume that even better space efficiency can be achieved with an even higher volume of data.
Update FrontEnd Settings (Grafana)
With the InfluxDB I had set the source for Grafana to the Prometheus instance.
This had a remote_read setting which then
fetched the data that was larger than the Prometheus retention (>3d) from the InfluxDB.
Remote read is not supported in VictoriaMetrics, as this is a complex operation.
Corresponding background information can be found in the FAQs Section "Why VictoriaMetrics doesn't support Prometheus remote read API?".
However, this is not really a problem, as VictoriaMetrics is Prometheus compatible and so the queries can also be made directly.
This reduced the changeover in the Grafana dashboards to the selection of a new data source, no query had to be adapted.
Conclusion
Switching to VictoriaMetrics has not only reduced the size of my database, it has also improved performance.
I don't have any benchmarks here and I'm not sure if this is due to the direct questions instead of the remote_read,
but at least everything feels faster, which supports the statements in the "Prominent features"
information.
This also seems to apply to CPU and RAM usage, here I have around 8% (CPU) and 29% (RAM) savings according to the metrics.